PROBLEM

STANDARD CENSUS DATA
- Census data is too coarse
- Usefulness can be limited
SOLUTION
CENSUS DATA MIXED WITH PROPERTY DATA*
- Mix census data with property appraiser information to improve resolution
* Based on the Cadastral-based Expert Dasymetric System (CEDS) developed by Maantay et al. 2007
INSPIRATION
"There is an urgent need for a data structure approach that can make population-related
data more appropriate for the needs of planners."
"Remodel the census data ... into a 'surface' that supports a continuous view of the population distribution." We should be able to answer the following types of questions:
Where are the oldest and most vulnerable?Where are children in poverty? "
"Remodel the census data ... into a 'surface' that supports a continuous view of the population distribution." We should be able to answer the following types of questions:
Where are the oldest and most vulnerable?Where are children in poverty? "
-DR. IAN BRACKENNoted British Geographer
VISUAL CENSUS DATA MODEL
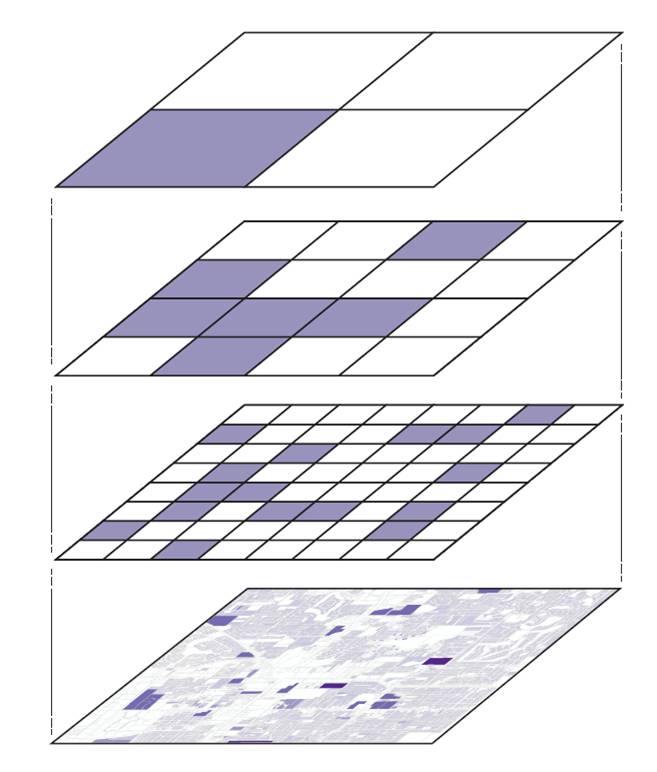
Multiple layers support multiple scales.
These ‘surfaces’ are useful for:
This layer is useful for:
- Visualizations
- Population totals and percentages
- Queries
- Analysis & modeling (uniform grids are ideal)
- Neighborhood visualizations
- Population totals
EXAMPLE: TWO VIEWS OF THE SAME NEIGHBORHOOD
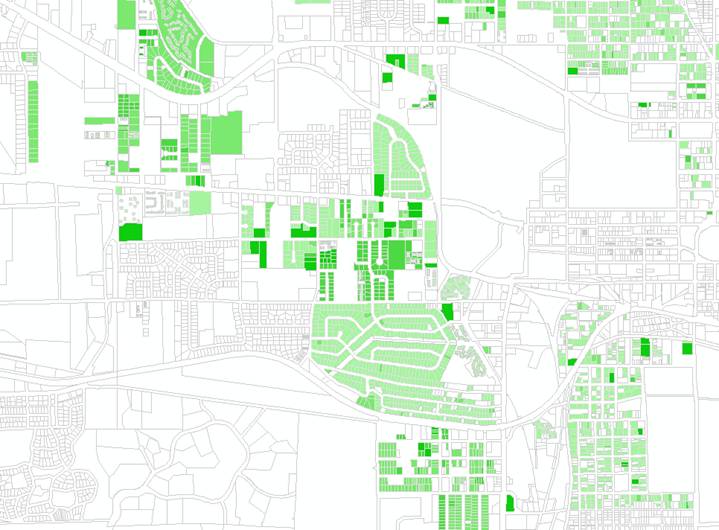
LINGUISTIC ISOLATION, SPANISH
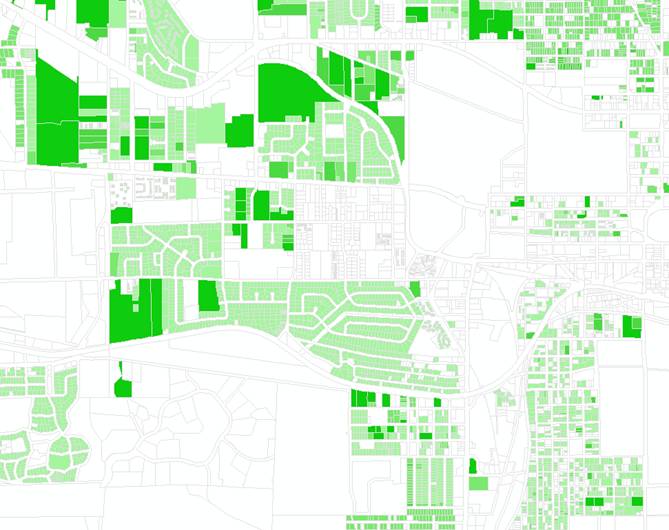
NO HIGH SCHOOL DEGREE
VISUAL CENSUS IS USEFUL FOR:
- Resource allocation
- Emergency response
- More accurate disease rates
- Targeting educational programs
- Anyone who uses census data
- And more!
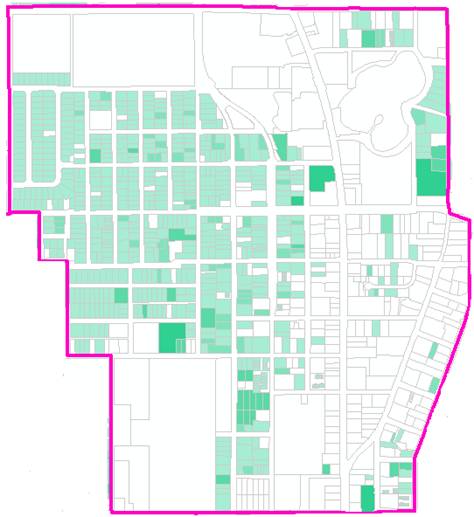
EXAMPLE: GADSDEN COUNTY FLORIDA TOTAL POPULATION
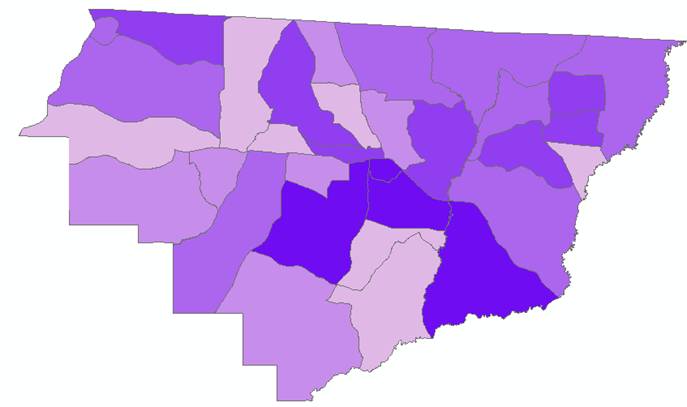
CENSUS BLOCK GROUPS
- Coarse resolution
- Artificial boundaries
- Abrupt changes at borders
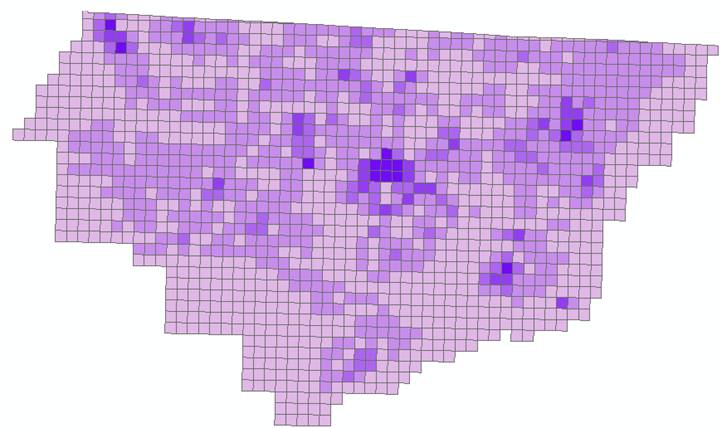
VISUAL CENSUS
- Fine resolution
- Uniform grid (cells same size and shape)
- Better reflects natural landscape
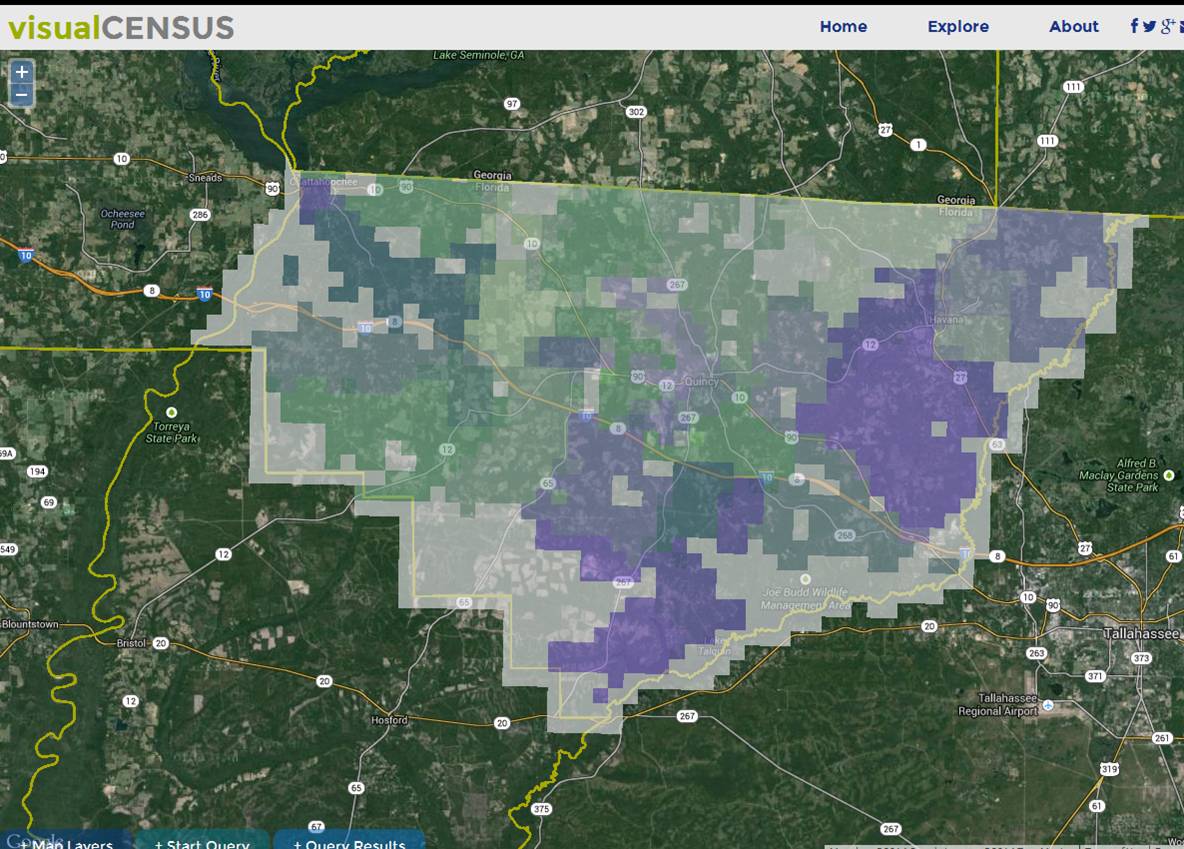
PROTOTYPE: ONLINE MAP FOR GADSDEN COUNTY FLORIDA
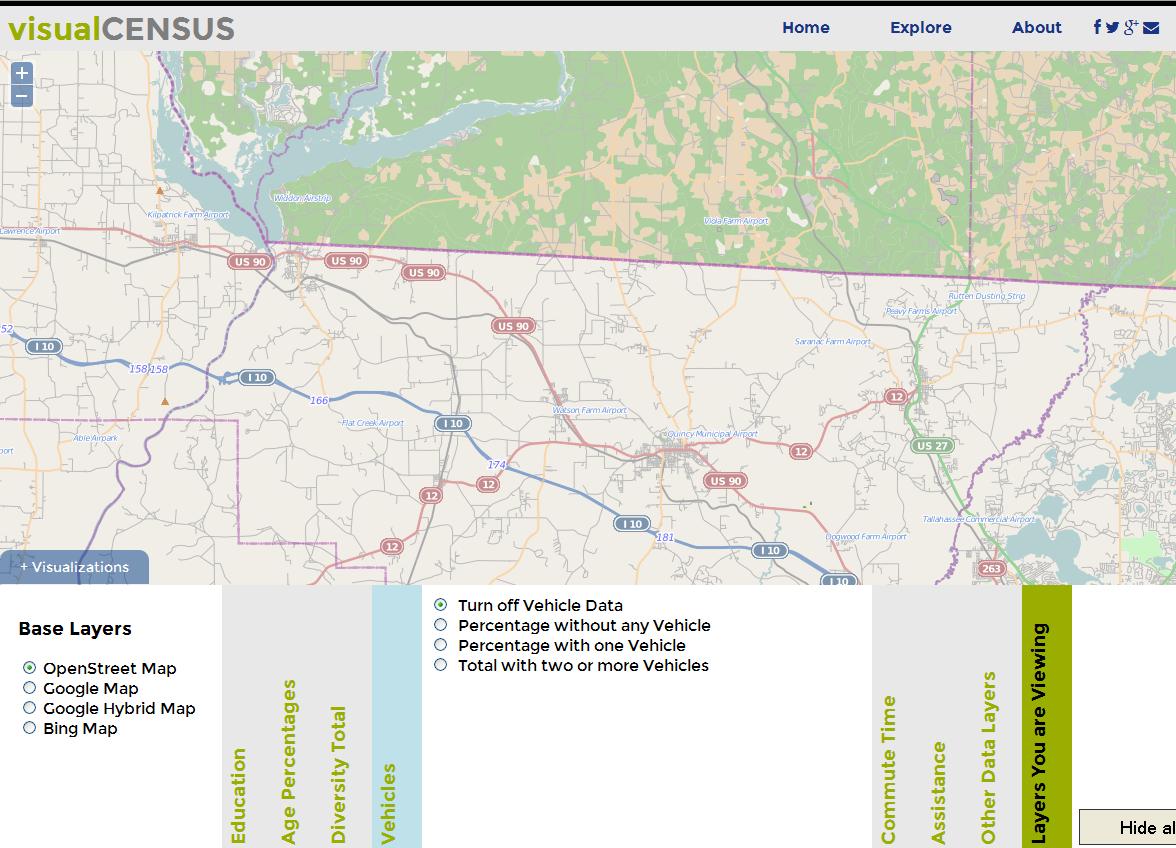
EXAMPLE: VISUALIZATION OF THOSE RECEIVING PUBLIC ASSISTANCE
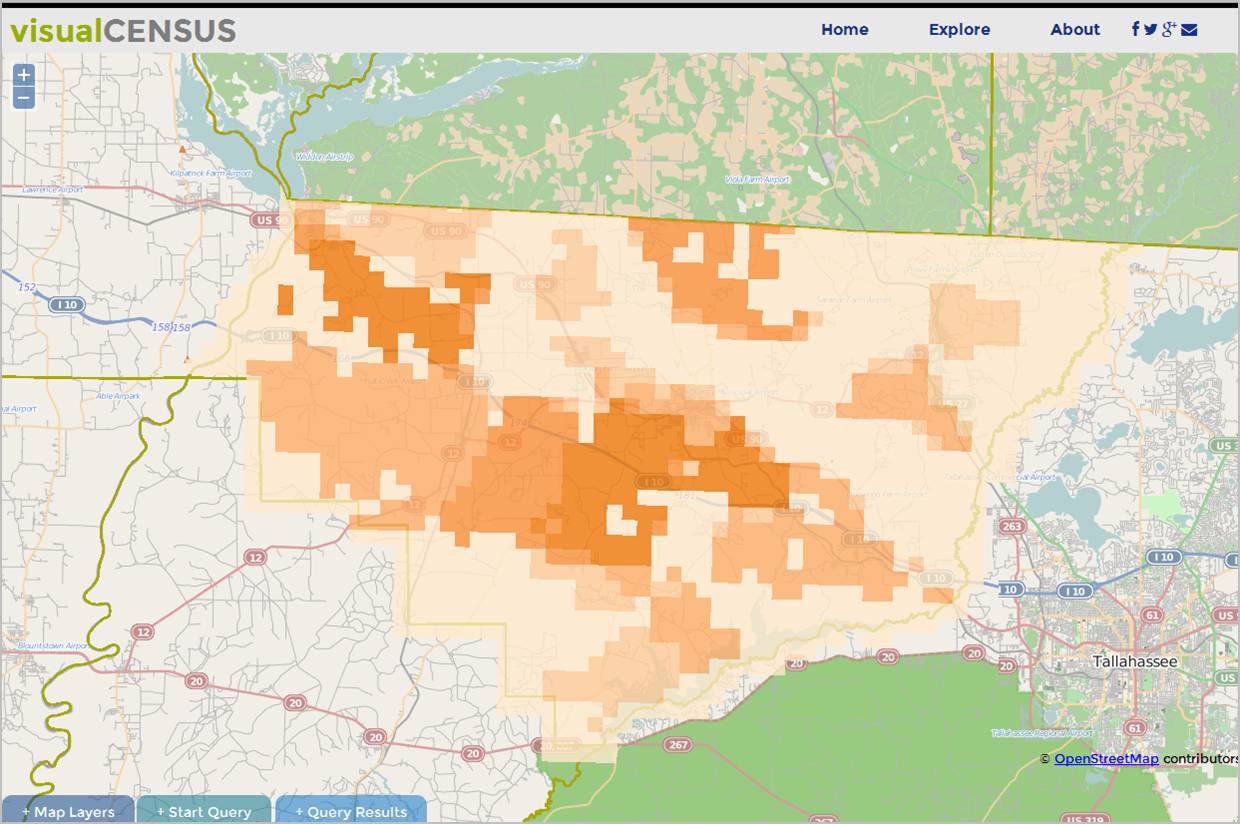
EXAMPLE: DISPLAY MULTIPLE LAYERS TO EXPLORE RELATIONSHIPS
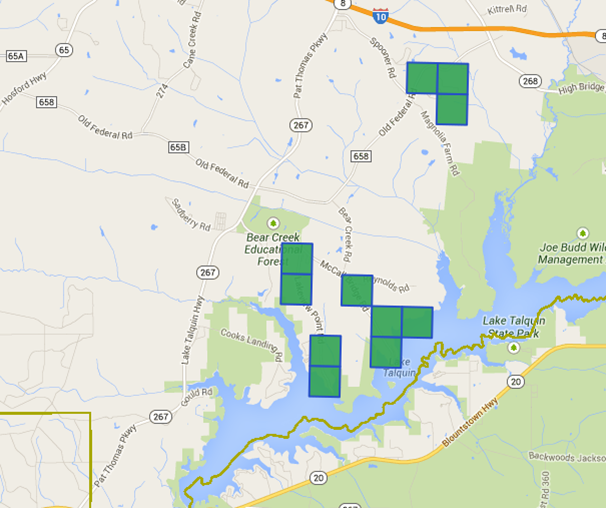
EXAMPLE: QUERIES HELP TARGET SPECIFIC AREAS
Where are high percentages of seniors?
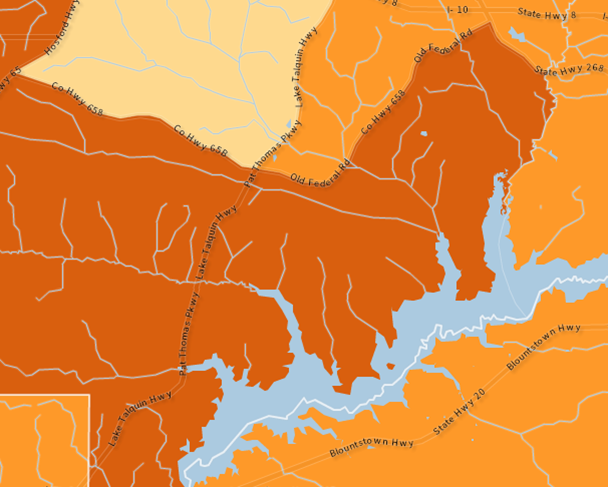
Census Tracts have Coarse Resolution
 = 20% Age 65+
Visual Census has High Resolution
 = 20% Age 65+
FUTURE WORK
This prototype of Gadsden County Florida was designed to demonstrate the
Visual Census data model.
Dr. Ian Bracken envisioned a planning tool that better suits the needs of planners. This prototype does not include his more complex ideas of spatial analysis and fancy printing tools. However, it is hoped that the functionality shown here demonstrates his key idea of census data restructuring.
There is ample room to expand this project: additional census data, exploration of uncertainty in the census data, more map functionality, data analytics, incorporation of other data, modeling, and addressing specific concerns of society.